Runtime exceptions tracking with Sentry
Table of Contents
Intro #
Modern applications are becoming larger and larger with each release, amount of code lines and complexity of the project are growing with each new feature or functionality. And the bigger your app becomes, the harder to maintain it, keeping the same productivity and pages/features load/execution speed. It gets harder to recognize problems and fix them or refactor the required part of the code in time. And sometimes it’s too late and already impossible. And that’s why it’s really important to monitor your application constantly to keep abreast with the project state. But how to track all possible performance issues, metrics, and users’ bugs, and don’t lose your mind?
… and here is Sentry entering the scene!
What’s Sentry? #
Sentry is a developer-first error tracking and performance monitoring platform that helps developers see what actually matters, solve quicker, and learn continuously about their applications.
According to the official Github repository, Sentry has lots of SDKs and supports all main programming languages such as:
- JavaScript
- React-Native
- Python
- Ruby
- PHP
- Go
- Rust
- Java/Kotlin
- Objective-C/Swift
- C#/F#
- C/C++
- Dart
- Perl
- Clojure
- Elixir
- Unity
- Laravel
- Electron
It makes Sentry a universal magic-stick for all sorts of teams and developers, because now you can track every part of your dream-project right in one place. Sentry provides you abilities:
-
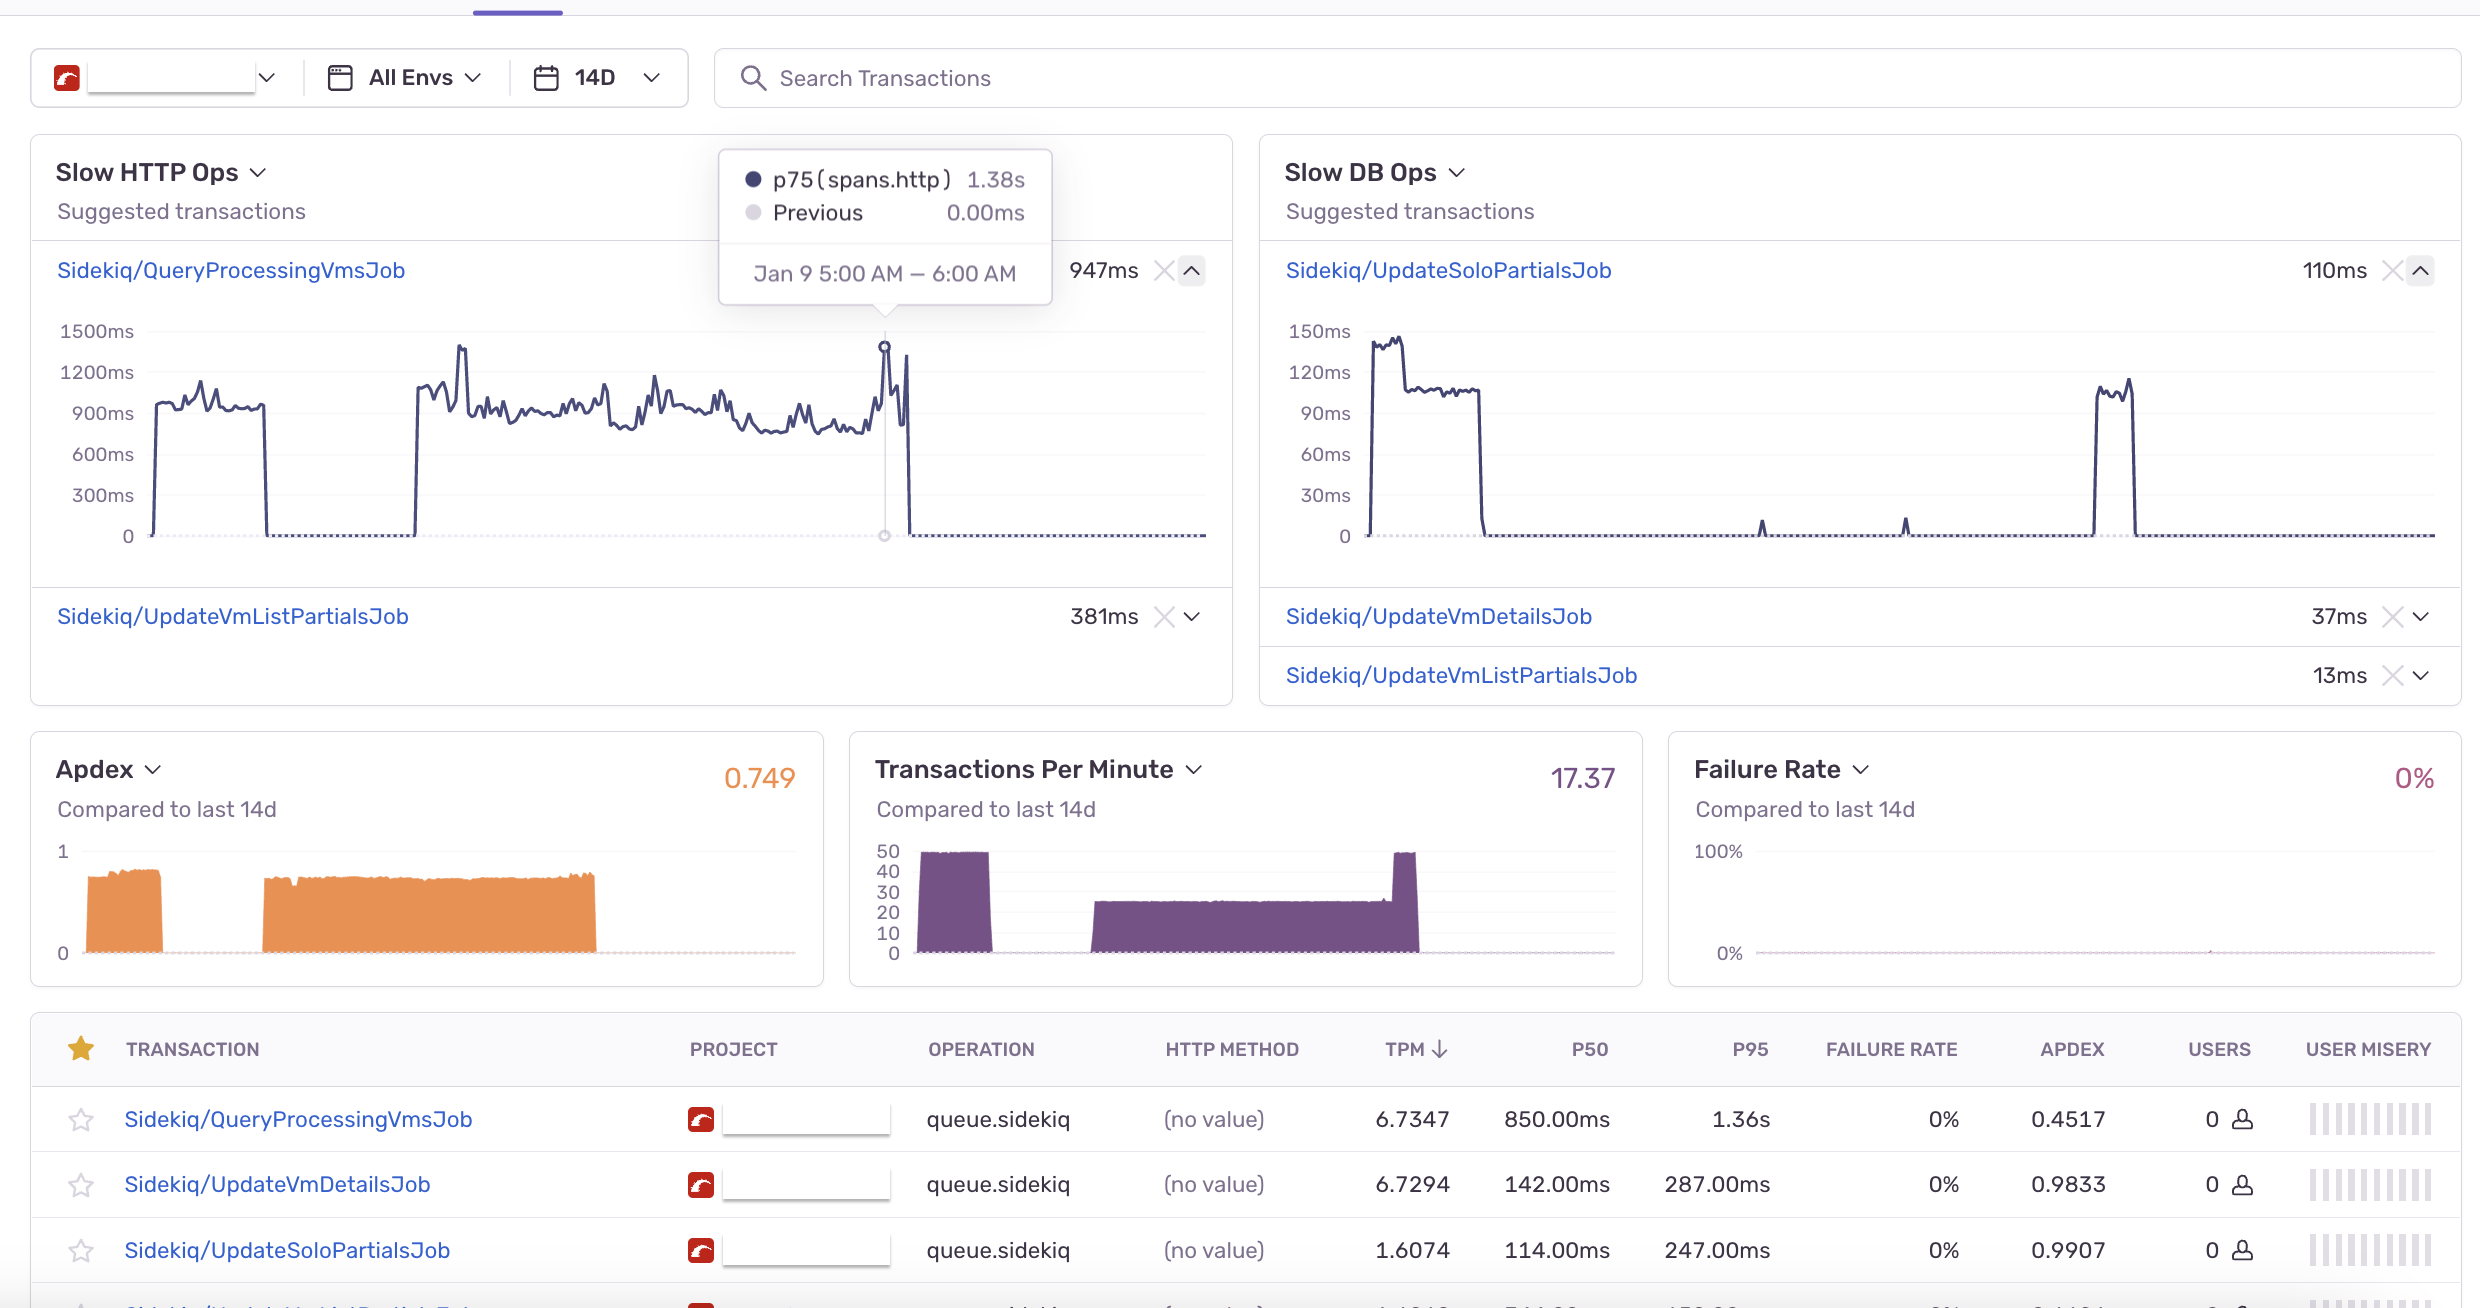
to track application performance metrics: measures metrics like throughput and latency, capture traces of transactions (such as a page load, page navigation, or an asynchronous task)
-
to notify about issues and alerts in the project: you have a real-time visibility into problems with your code and the impact on your users.
-
to send you other notifications about various things like issue state changes, release deploys, and quota usage.
-
to collect information on Content-Security-Policy CSP violations, as well as Expect-CT and HTTP Public Key Pinning (HPKP)
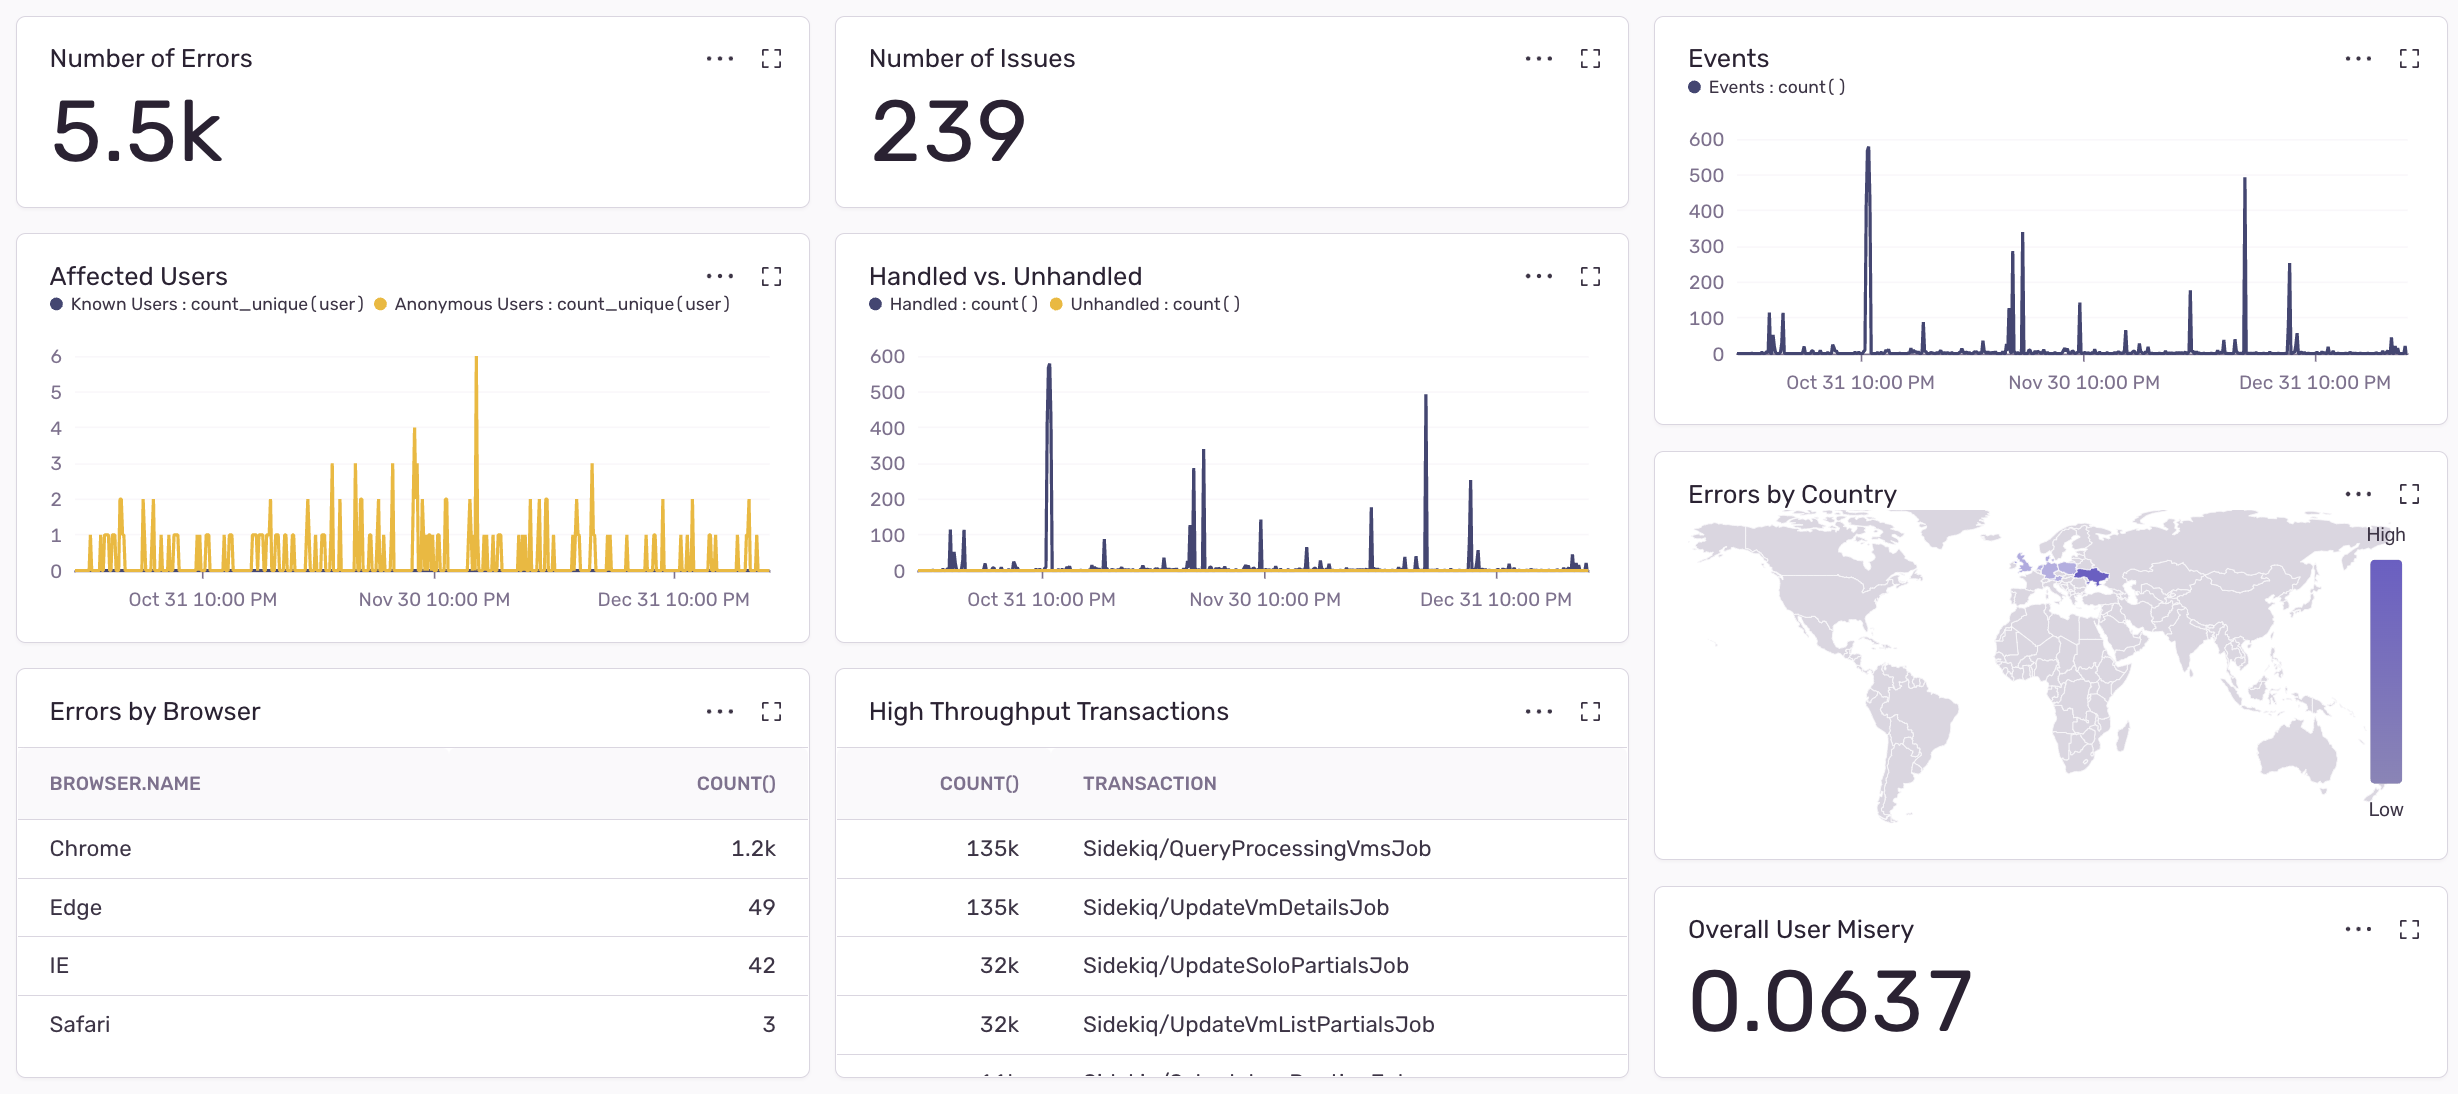
By configuring dashboards with all the required panels on your own, you can create a unique workspace for you and your team to have quick access to all the necessary information and metrics!
How to setup it? #
-
First of all, you should complete registration steps on the official web-site.
-
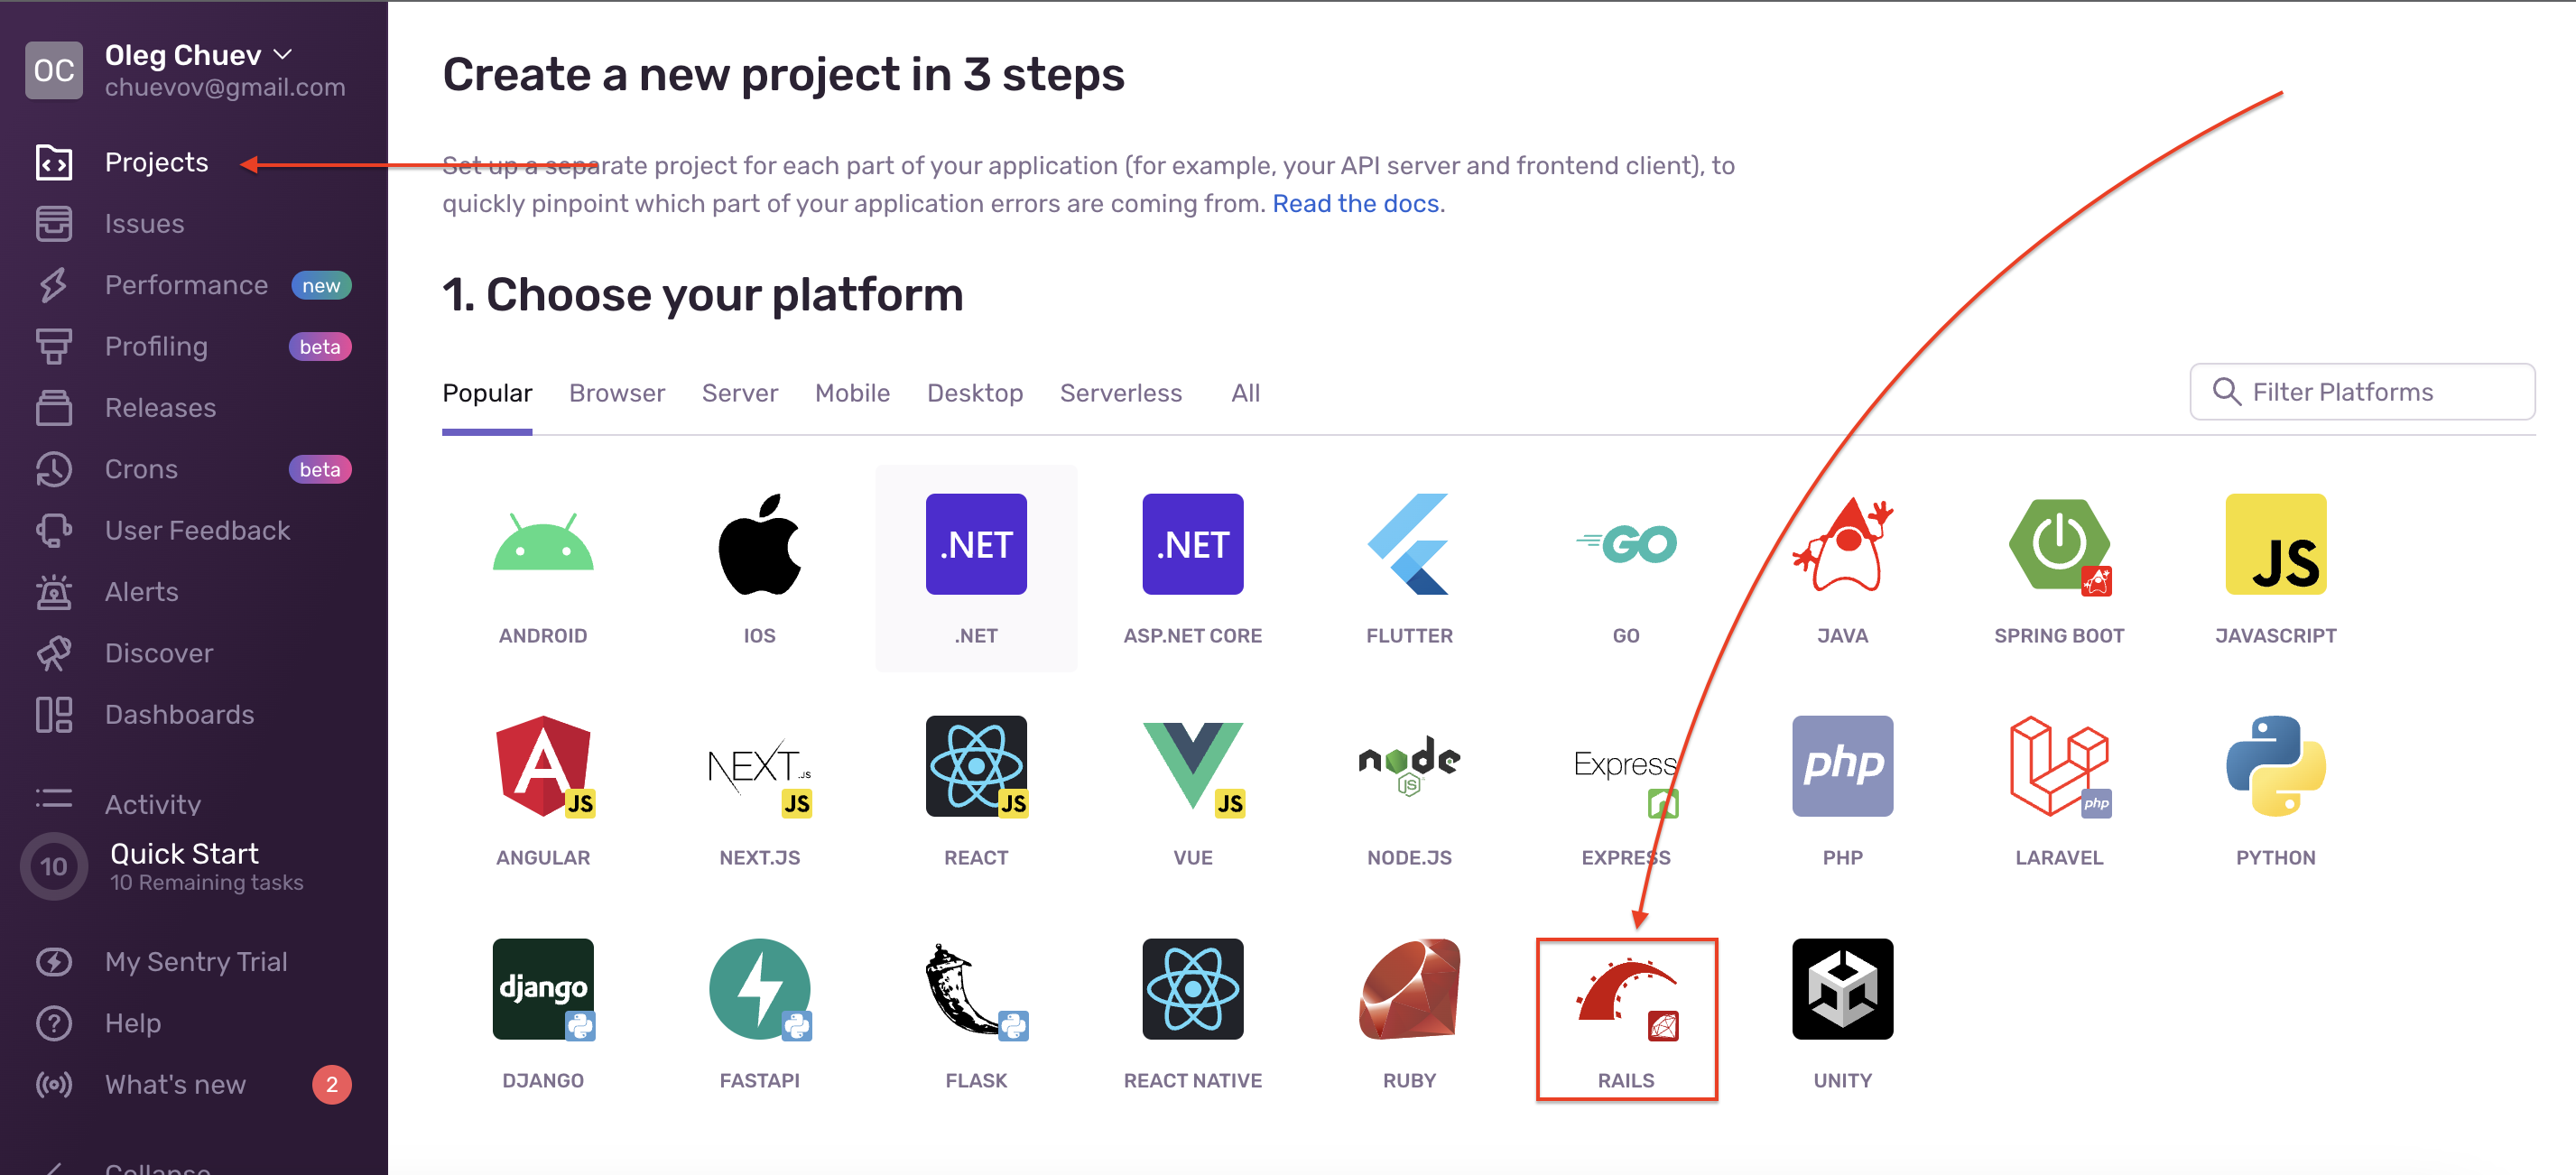
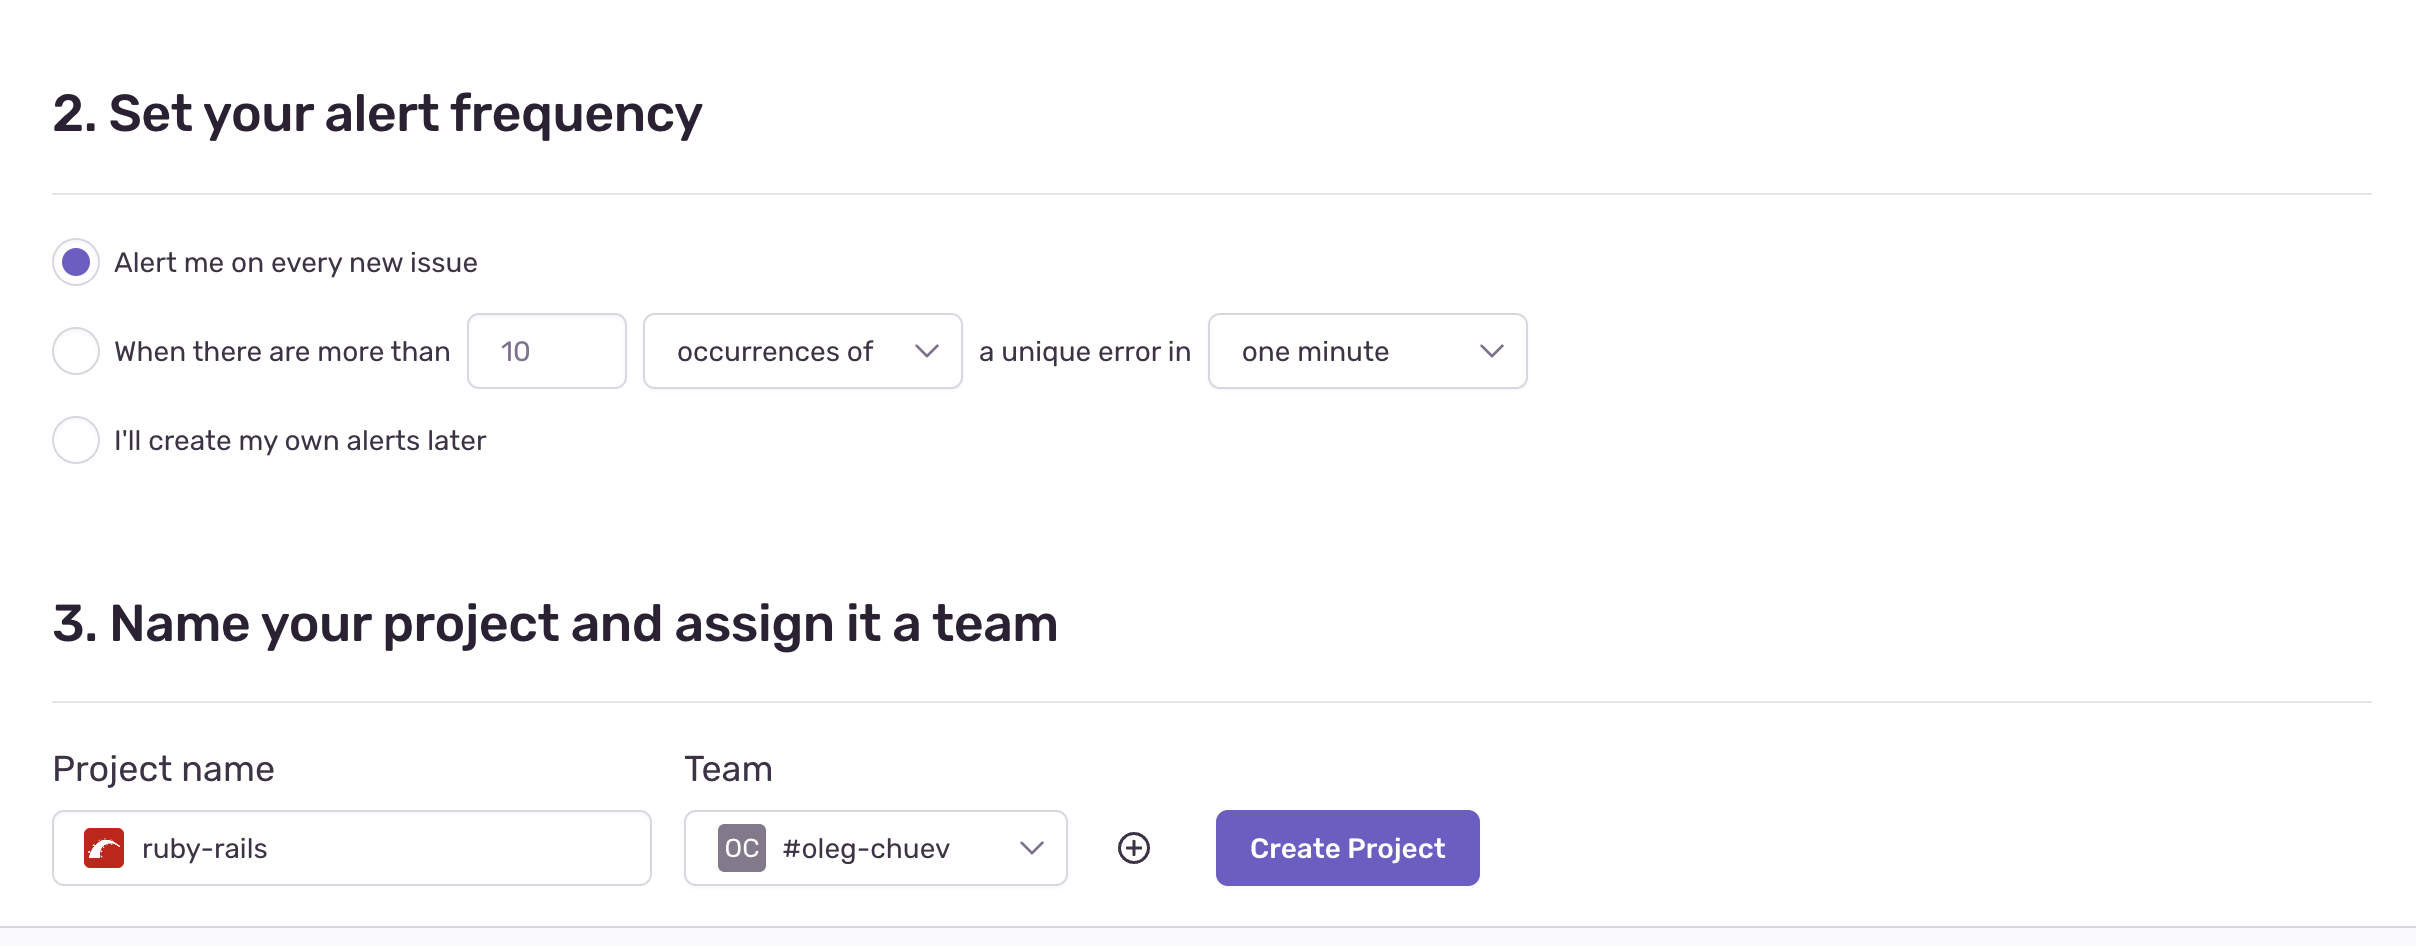
When you’re in, name your project, select a platform and alert frequency. We’ll select a Rails application and “Alert me on every new issue” option to be in touch with our bugs.
- Now let’s add
sentry-rubyandsentry-railsgems to our Gemfile and runbundle install
# Gemfile

  gem "sentry-ruby"
gem "sentry-rails"- We should also create the configuration file:
# config/initializers/sentry.rb

  Sentry.init do |config|
    # please, note that config.dsn value is unique and confident data.
    # don't leave it in a public.
    # you can find your dsn address in the Sentry
    config.dsn = 'https://*********/.ingest.sentry.io/************'

    # :active_support_logger - Built on top of ActiveSupport instrumentation and provides many Rails-specific information.
    # :http_logger - It captures requests made with the standard net/http library.
    config.breadcrumbs_logger = [:active_support_logger, :http_logger]

    # set traces_sample_rate to 1.0 to capture 100%
    # of transactions for performance monitoring.
    config.traces_sample_rate = 1.0
end- And that’s it. Now your app is sentry-go!
Now our Rails application is ready to catch our bugs, so let’s try to create one.
# app/controllers/welcome_controller.rb
class WelcomeController < ApplicationController
def index
# some code
# oops, exception!
a = 1 / 0
# render some partial
end
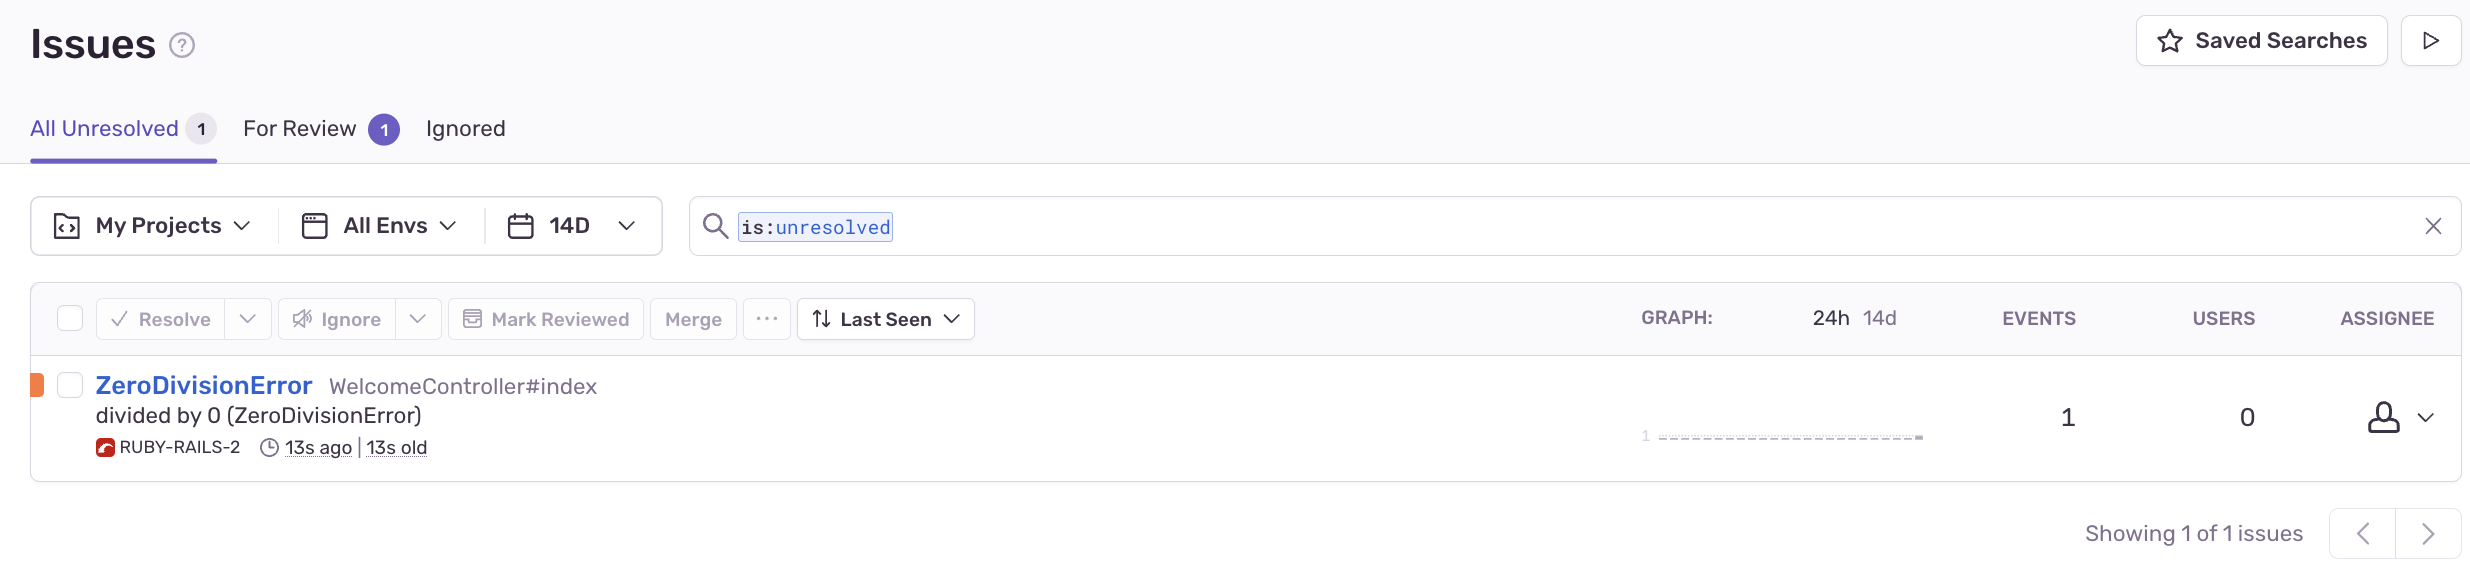
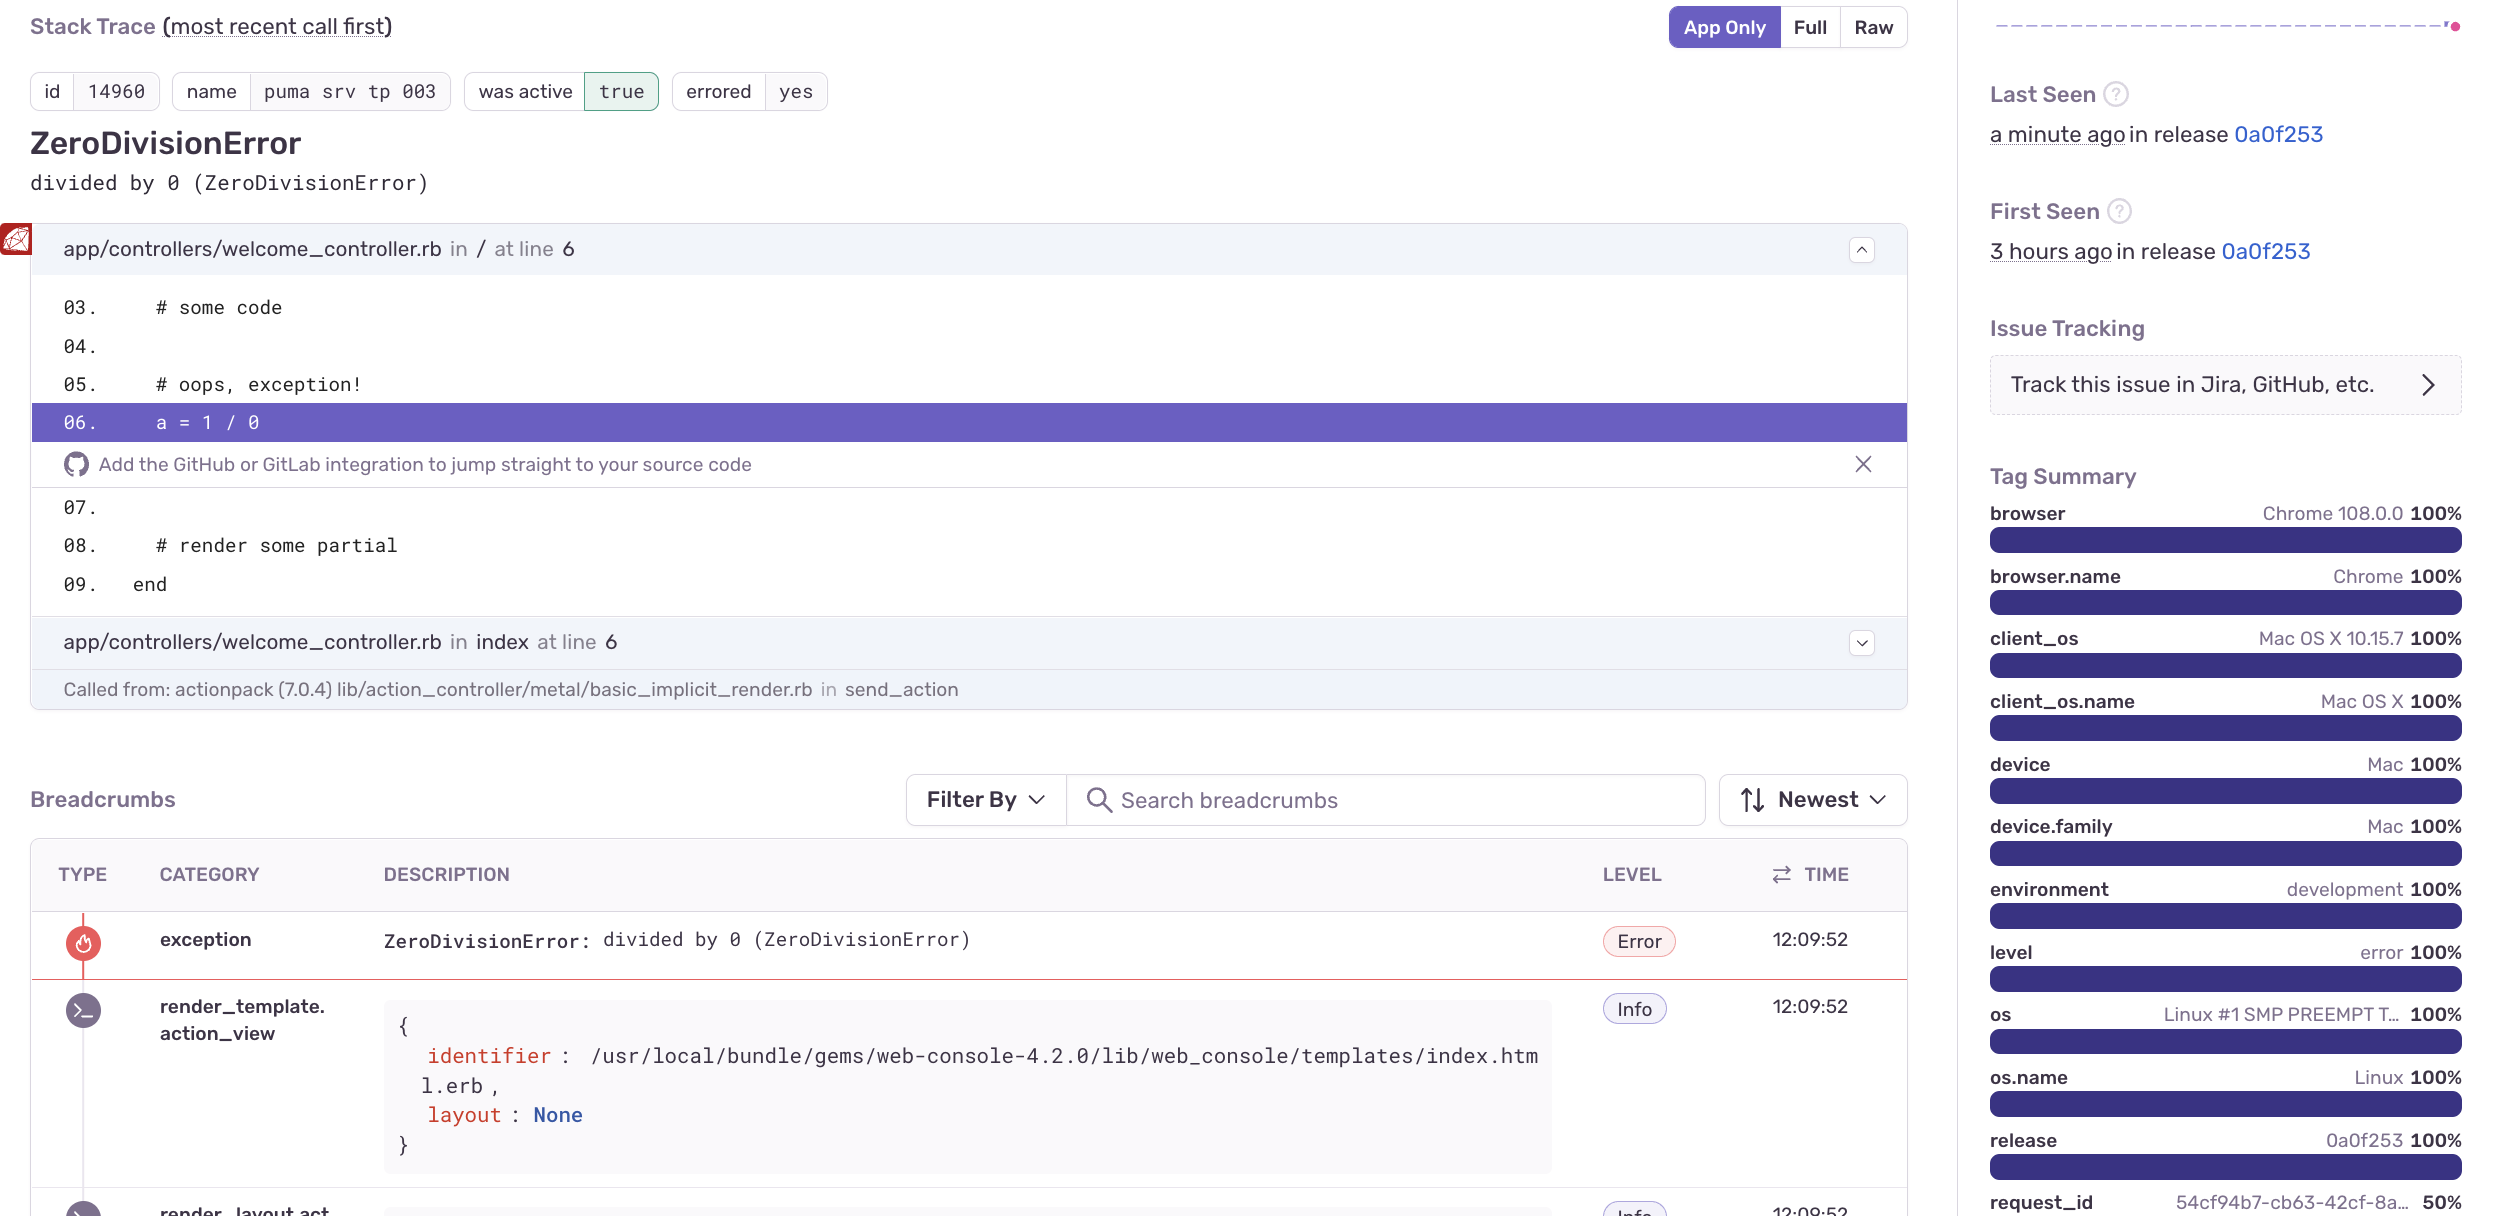
endWhat will happen when our potential user catches an exception?
As you can see, information about the issue appeared on the platform, on the Issues tab. You can check the issue itself, its backtrace, and some common information about the context. It makes debugging and fixing way faster and easier.
By the way, you can also trigger Sentry events manually with different severity levels.
Available levels are :fatal, :critical, :error, :warning, :log, :info, and :debug.
The default, if not specified, is :error.
Sentry.capture_message("Some message", level: :info)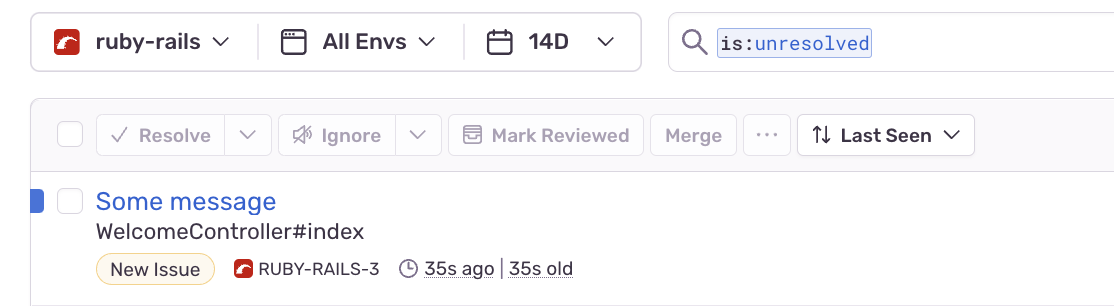
However, let’s make our work more comfortable. We will tweak our sentry.rb file with additional options and take to pieces how they work.
# config/initializers/sentry.rb

  Sentry.init do |config|
    ...

    # 0 - if you want to send events synchronously
    # 1-.. - By default, the worker holds a thread pool that has [the number of processors] threads
    config.background_worker_threads = 0

    # you can configure Sentry to run only in certain environments
    config.enabled_environments = %w[staging production]

    # Sentry automatically sets the current environment to RAILS_ENV, or if it is not present, RACK_ENV
    config.environment = Rails.env

    # if you want to skip some specific exceptions
    config.excluded_exceptions += ['ActionController::RoutingError', 'ActiveRecord::RecordNotFound']

    # to clean up exceptions' backtrace before it's sent to Sentry
    config.backtrace_cleanup_callback = lambda do |backtrace|
      Rails.backtrace_cleaner.clean(backtrace)
    end
    ...
  end
List of all configuration options you can find in the Sentry guide by the next link.
Gems for rails #
Additionally, depending on the integrations you want to have, you might also want to install next gems:
To be able to track Sidekiq metrics and issues:
gem "sentry-sidekiq"To be able to track delayed_job asynchronously executing longer tasks in the background metrics and issues:
gem "sentry-delayed_job"To be able to track resque background jobs metrics and issues:
gem "sentry-resque"For usage of OpenTelemetry with Sentry
gem "sentry-opentelemetry"Integrations #
Sentry’s integration platform provides a way for external services to interact with Sentry as well as with your internal services. Generally, list of all supported external services can be split into several categories:
- Notification & Incidents (Slack, Twilio, MS Teams etc)
- Source Code Management (GitLab, GitHub, Bitbucket, Azure DevOps)
- Visualization (Grafana)
- Issue tracking (Jira, Trello etc)
- Release Management (Jenkins, CircleCI, Netlify etc)
- Deployment (Heroku, Vercel)
… and way more!
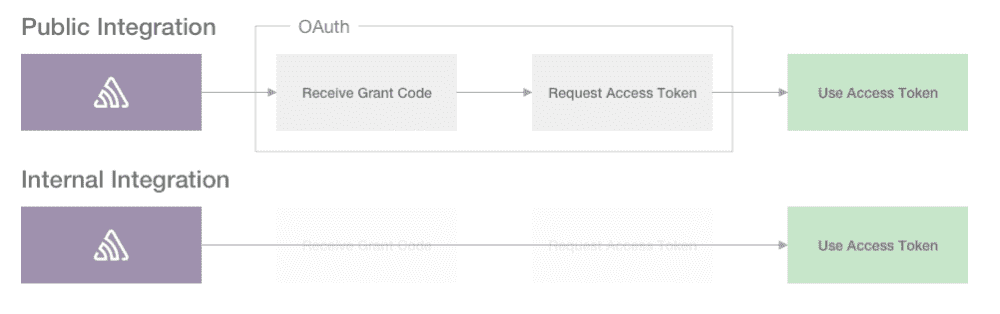
Full list of public integrations can be found in the Sentry settings, Integration tab. And, of course, you’re able to create your own integrations. Internal integrations don’t require an OAuth flow.
We are ready to provide expert's help with your product
or build a new one from scratch for you!