Data transformations and cleaning for efficient Power BI reporting
Table of Contents

The goal of data preparation #
Since the raw data we encounter often consists of mistakes and vulnerabilities, data transformation and cleaning is one of the crucial stages to achieve valuable insights and compelling visuals during Power BI reporting. The process of data preparation is frequently considered as an implementation of the ETL concept. In this article, we will delve into the significance of this stage and how it can make or break the effectiveness of our visualizations.
ETL concept in Power BI or why should you use Power Query for data preparation? #
Extract, transform, and load (ETL) improves business intelligence and analytics by making the process more reliable, accurate, detailed, and efficient. In Power BI, we can reap the benefits of the concept by using the Power Query editor to work with source data:
- Data Source Agnosticism: Power Query is designed to connect to a wide range of data sources, including databases, spreadsheets, APIs, and web services. This makes your data preparation process more modular and source-agnostic.
- Data Reusability: Transformations performed in Power Query can be saved as queries and reused across multiple reports and datasets.
- Data Quality Assurance: Power Query provides a visual interface with step-by-step transformations, making it easier to inspect and validate data as you work on it so you can fix issues such as missing values, duplicates, or inconsistencies early in the process.
- Performance Optimization: Data transformations are optimized for query folding meaning that when you perform transformations at the source in Power Query, its engine can push many of these operations back to the data source for execution.
- Data Model Efficiency: Pre-processing and cleaning data can reduce the complexity of your Power BI data model. This leads to faster report rendering and more efficient use of system resources.
- Advanced Transformations: Offers a wide range of transformation options, including conditional logic, merging, pivoting, and more, which can be easier to implement in Power Query than in Power BI’s DAX language.
Power Query transformations best practices #
Generally, all tools Power BI provides for working with data are optimized for better performance, but sometimes there are still several ways to achieve the same with different effectivity and you should choose one of them carefully.
How to choose right function to use? #
Most common functions and transformation flows are well described in the training by Microsoft, nevertheless, you should still use critical thinking to satisfy your need in specific cases. If you are not sure what approach would be preferable in some particular case - look for a documentation that can explain how one or another function works and how it affects performance.
Avoid overburdened datasets #
Performance of your visualizations is directly depends on the size of your dataset. In most cases, raw data contains a lot of redundant information that won’t be used for visualizations and getting insights. Sometimes, even data that we need in our dataset can be transformed to reduce the whole dataset size.
That’s why every time you should pay attention for working with new data sources and contribute your time to determine what data will be valuable for you and to check if it is well-formatted.
To increase the performance of the further transformations, you should remove unnecessary data in the earliest possible step.
Power Query analysis tools #
Do not neglect analysis tools Power Query provide to help you build faster and more robust dataset. There are a lot of functions that can help you to determine where are vulnerabilities in the source data, where ’null’ value or errors can occur after specific formula used to transform a particular column, etc.
Power Query M-language VS Python for advanced transformations #
When you perform any changes on your data in the Power Query editor, they actually will be accomplished by calling some M-Language functions. These functions calls are recorded, and you can look at them in the Advanced Editor.
Beside this, you can write your own M-Language scripts to make advanced transformations, add complicated calculated columns, etc.
In additon, Power Query provides the ability to use Python scripts for performing operations with data. Event though most developers are more familiar with Python scripting, M-Language still be more preferable for accomplishing advanced operations. M is extraction layer and most of the transformations you write are sent down the pipe while extracting data. It uses an engine that is optimized for what its doing while Python is an interpreted language.
To normalize or not to normalize that is the question #
Since data you extract can be from different sources you most likely will encounter different formats. Especially, depending on the type of the data source, sometimes it can be normalized data, sometimes not.
In the world of software development it became a standard to normalize operational databases and use the third normal form for it. Such an approach helps to reduce the duplication of data, avoid data anomalies, ensure referential integrity, and simplify data management. On the other hand, software, which goal is to analyze data (take a look at Online Analytical Processing (OLAP)) usually doesn’t work with business’ operational data (data that describe a current state of the business, current users’ information, etc.) - it requires historical data, from which we can get insights and reveal hidden patterns. Furthermore, since this data will be used in different way rather as operational data sources, it should be organized in different way as well!
Let’s go back to the question, should we normalize historical data we gathered for data analytics? There isn’t one exact answer and it depends on the particular case, however, in most scenarios you still need to normalize your data to achieve a Star-schema model for your dataset.
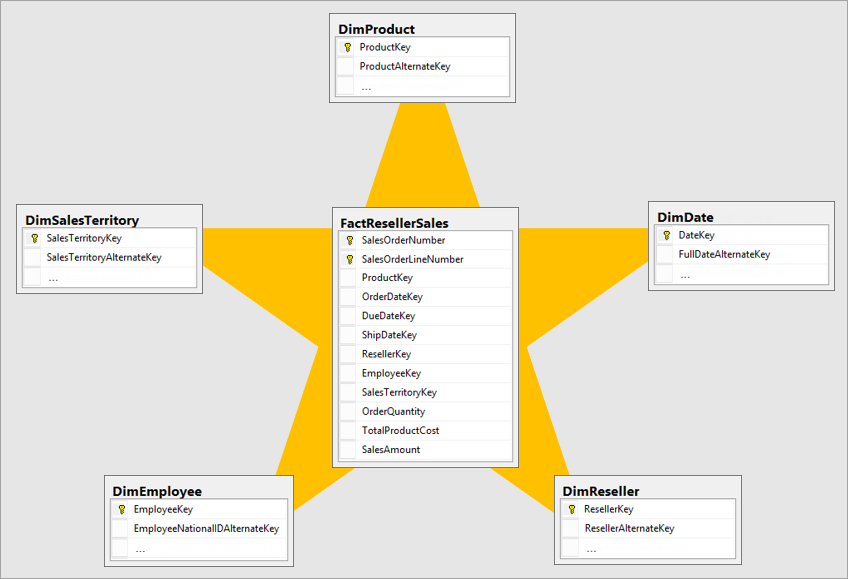
What is Star-schema? #
A Star schema is a data modeling technique commonly used in data warehousing (it is a common approach to build a datawarehouse for your OLAP). Star schemas make it easy to retrieve and analyze data, making them well-suited for business intelligence and reporting applications. Star schema comprised of the such components:
- Fact Table: There is a central fact table that contains quantitative data, such as sales or revenue.
- Dimension Tables: Surrounding the fact table are dimension tables that provide descriptive information, such as customer names or product categories.
- Relationships: The fact table is linked to the dimension tables through foreign keys, creating a star-like structure.
Suach an approach provides:
- Simplicity: Star schemas are simple to understand and query, making them efficient for analytical reporting and data analysis.
- Optimized for Performance: They are optimized for query performance, as the denormalized structure minimizes the need for complex joins.
Practice time! #
Where to find sample source of data for your pet-project #
There are a lot of services that can help you to find interesting data for analysis. Most often I use Google Dataset Search and today we are going to consider data I found using it.
Sample data is an example of the Spotify users’ behavior and it can be accessed here.
Add data source to the project #
If you are reading this article you already have Power BI Desktop installed on your machine. Open it and navigate to Power Query by pressing Transform data button on the top pane.
As I mentioned earlier, any operation in the Power Query editor, we can accomplish at least in two ways:
- Using UI
- By writing M-Language query
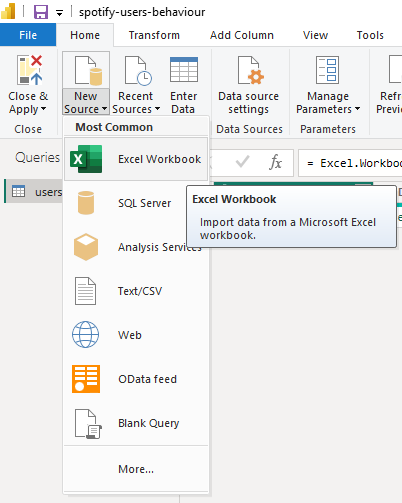
Since my dataset is a simple .xlsx file I can extract it easily by choosing Excel Workbook in the New Source dropdown.
Once data is extracted, let’s check the Advanced Editor to see how this step was recorded using M-Language.
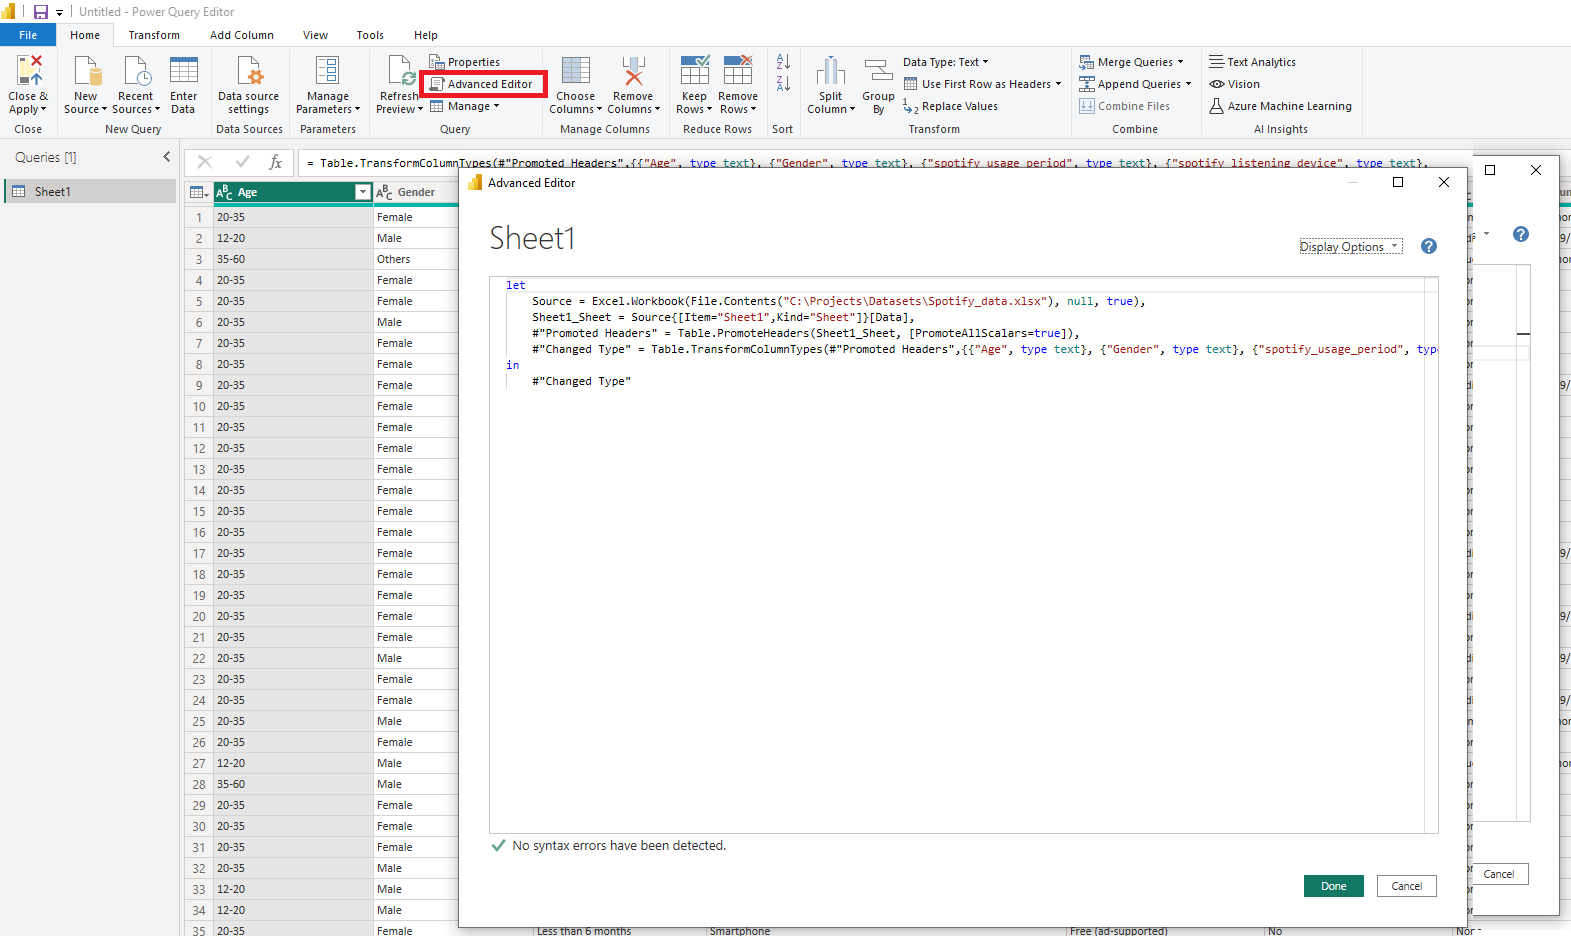
As you can see, behind the scenes Power Query performed even several steps for us:
- Extracted data from the Excel Workbook
- Recognized top row as a header row
- Matched types according to the content
Data exploring #
When data is extracted to the Power Query, we can start looking for issues and opprtunities to shape it for our needs. As you can understand, a lot of transformations will depend on insights that you would like to get from the data. Nevertheless, after the analysis, I determined some steps, that I would like to perform with our data:
- Give the table a descriptive name
- Fix spelling mistakes in some of the column names. For example, preffered_premium_plan column should be preferred_premium_plan.
- Fix the format of some particular values in some of the columns. For example, classical genre from the fav_music_genre column is written with a lowercase letter while all other genres are written with capital one.
- Prepare data to be used in a Star-schema
Performing steps #
Renaming table #
To rename a table, just right-click on it and choose Rename. I renamed it to users_behaviour (this name you will use after loading the dataset to the Power BI Desktop).
Fixing column names #
Now, let’s fix mistakes in columns’ names. Generally, it is a pretty easy operation - you can do it by double-clicking the column header and typing a new name. But, again, this step will be actually performed by calling the M-Language function. What if we try to accomplish this step by writing M-Language code directly?
Open Advanced Editor again. Add comma after the last row in the let block and add new row with the following formula:
#"Fix spelling mistakes in columns names" = Table.RenameColumns(
    #"Changed Type", {
        {"preffered_premium_plan", "preferred_premium_plan"},
        {"preffered_pod_format", "preferred_pod_format"},
        {"preffered_pod_duration", "preferred_pod_duration"}
    }
)
RenameColumns function accepts two arguments:
- Table name
- List, which contain old column name and a new one. In our case, we used list of such lists to rename several columns by one query.
Then, after the in keyword enter #“Fix spelling mistakes in columns names” instead of #“Changed Type”.
By clicking Done you’ll fix spelling mistakes in the columns’ names.
Fixing data in the particular column #
As I suggested earlier let’s consider such transformation in the fav_music_genre column. If you press the arrow near the column name, you will see all the distinct values this column contains.
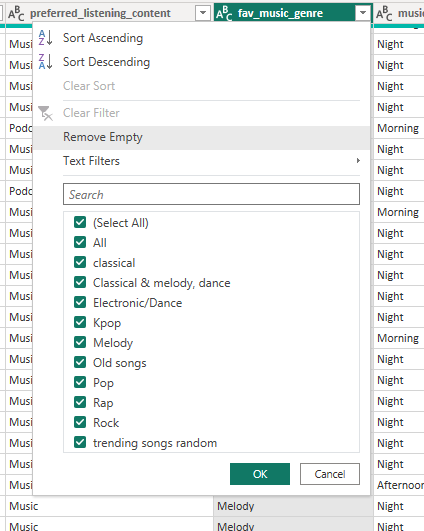
As we can see, all the values start with a capital later except classical and trending songs random. We will fix it using M-Language again, but now let’s simply right-click on the latest step in the Query Settings pane at the right and choose Insert Step After.
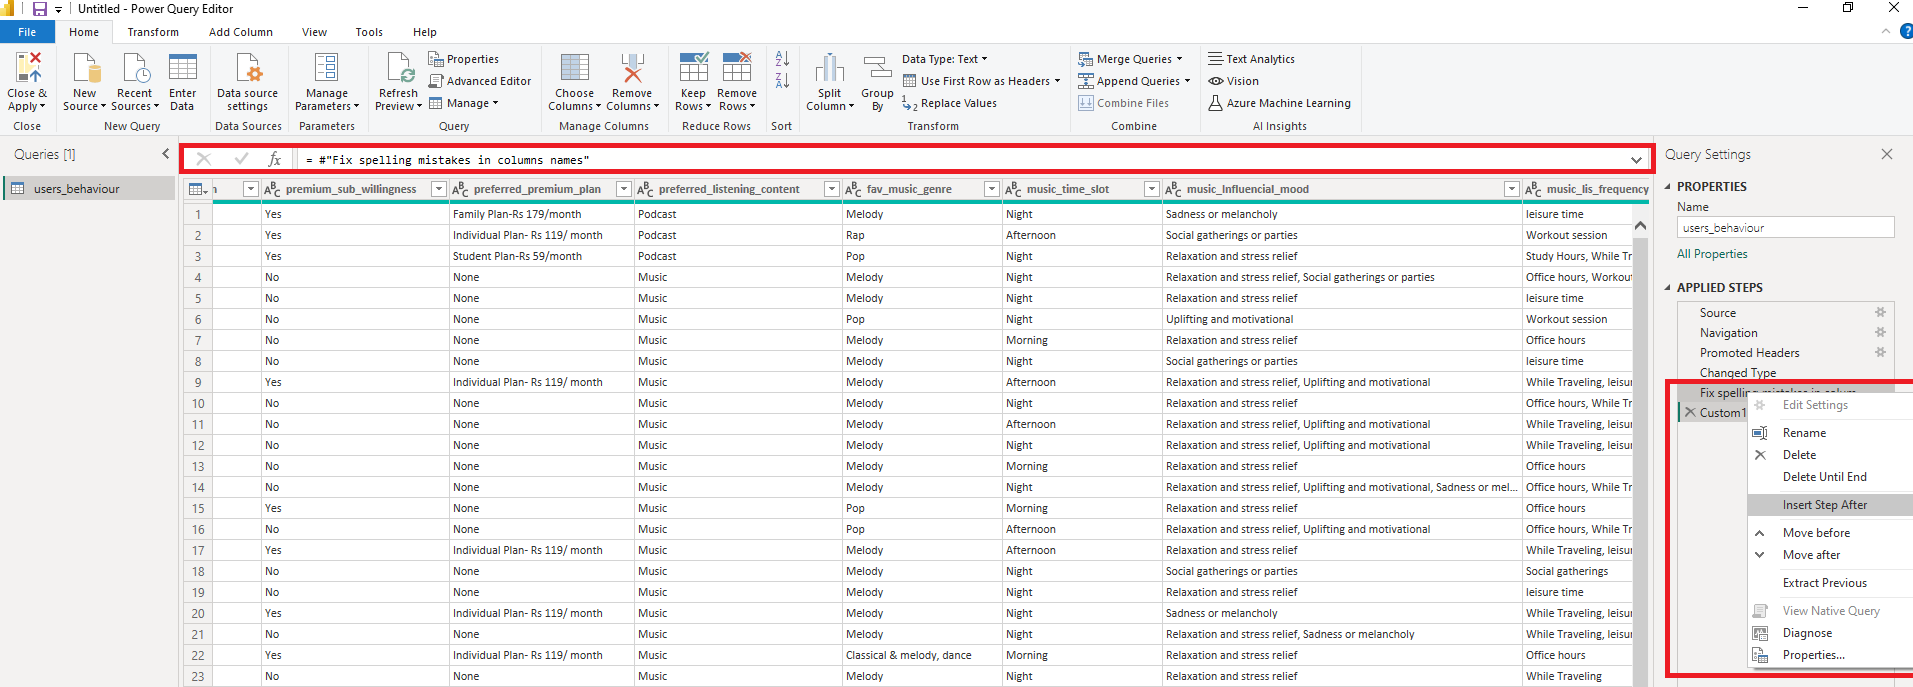
After the new step is created, press on it, and you’ll be able to enter the formula into the field above our table.
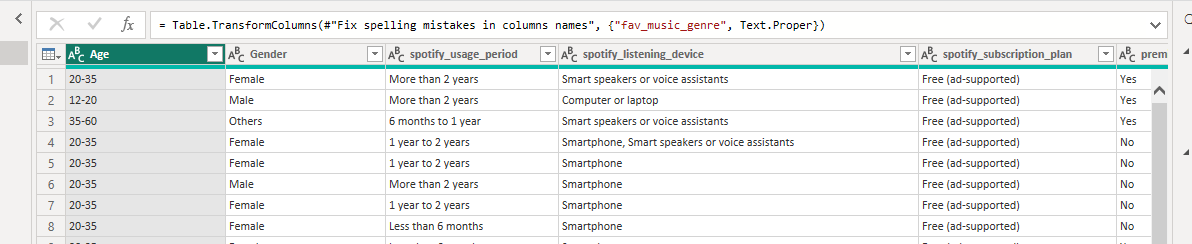
= Table.TransformColumns(#"Fix spelling mistakes in columns names", {"fav_music_genre", Text.Proper})There we used TransformColumns function, that accepts two arguments too:
- Table name
- List, which contains column name and a transformation, that have to be performed with this column. In our case, we used Text.Propper function for the column, which capitalize first letter of each word.
After performing this query, values in the fav_music_genre column will be fixed to Classical and Trending Songs Random. It already looks better but the genre Trending Songs Random value is a little weird, isn’t it? I suggest replacing it with a simpler one Trending. To do it, add the following formula:
#"Fix Trending genre" = Table.ReplaceValue(
    Custom1,
    "Trending Songs Random",
    "Trending",
    Replacer.ReplaceValue,
    {"fav_music_genre"}
)ReplaceValue function that we used accepts following arguments:
- Table name
- Value to replace
- New value
- Replacing function
- Column, where values should be replaced
Data preparation for the Star Schema #
Our example data is pretty simple and to prepare it to be used in a Star Schema we just need to move columns that describe users’ behaviour to separate tables (dimension tables). Let’s consider such transformation on the column we are already familiar with - fav_music_genre.
Firstly, we need to create separate table music_genres with names of music genres only. Note, that we need all performed steps in a separate table as well. To do it, we need to create a copy of the existing table first. Simply right-click on the name of users_behaviour table at left and choose Duplicate. Then, rename created table to music_genres. Now we have a copy of the table, and we need to remove redundant columns.
At this moment we could remove unnecessary columns and that’s it, but it would mean, that all previous steps will still be applied to the whole table that can affect performance. To eliminate such risks, let’s insert new step after Navigation step. To remove unnecessary columns, write the following formula for this step:
= Table.SelectColumns(
      #"Sheet1_Sheet",
      "Column9"
  )
This expression can look confusing. To find out what’s going on, take a look on how table looks like on the previous step and how it described in the Advanced Editor.
As you can see, before the Promoted Headers step, the first row of the table hasn’t been used as a header for the table. That’s why all columns named with pattern ColumnN, where N is an order number.
In addition, as you could notice from the Advanced Editor, even though name of the step is Navigation, the result of extraction was saved to the variable Sheet1_Sheet, that’s why we use this name to reference previous step.
Once you selected only fav_music_genre column, you’ll probably have exceptions in steps, that reference other columns, especially Changed Type and Fix spelling mistakes in columns names in my case. Since these steps don’t affect fav_music_genre column, we can delete them to fix the issue.
On this stage, I would like to rename the column. Since we already described in the table name what it contains, we can use name for the column in this case.
Now, we have to leave only distinct values in the column. Add step with the formula:
#"Get distinct values" = Table.Distinct(#"Renamed Columns")The last thing left to do, is to add indexes to the table, so we will have opportunity to reference it in our fact table. Following expression will do it for us.
#"Add indexes" = Table.AddIndexColumn(#"Get distinct values", "id", 1, 1, Int64.Type)There we used AddIndexColumn function. To make it work, we need to send name of the index column, initial value, increment and type of the column to it.
Our dimension table is ready, let’s replace the value fav_music_genre column in the fact table (users_behaviour) with ids. In the Power Query such step called Merge Queries. We can accomplish it using UI by choosing Merge Queries function on the top pane.
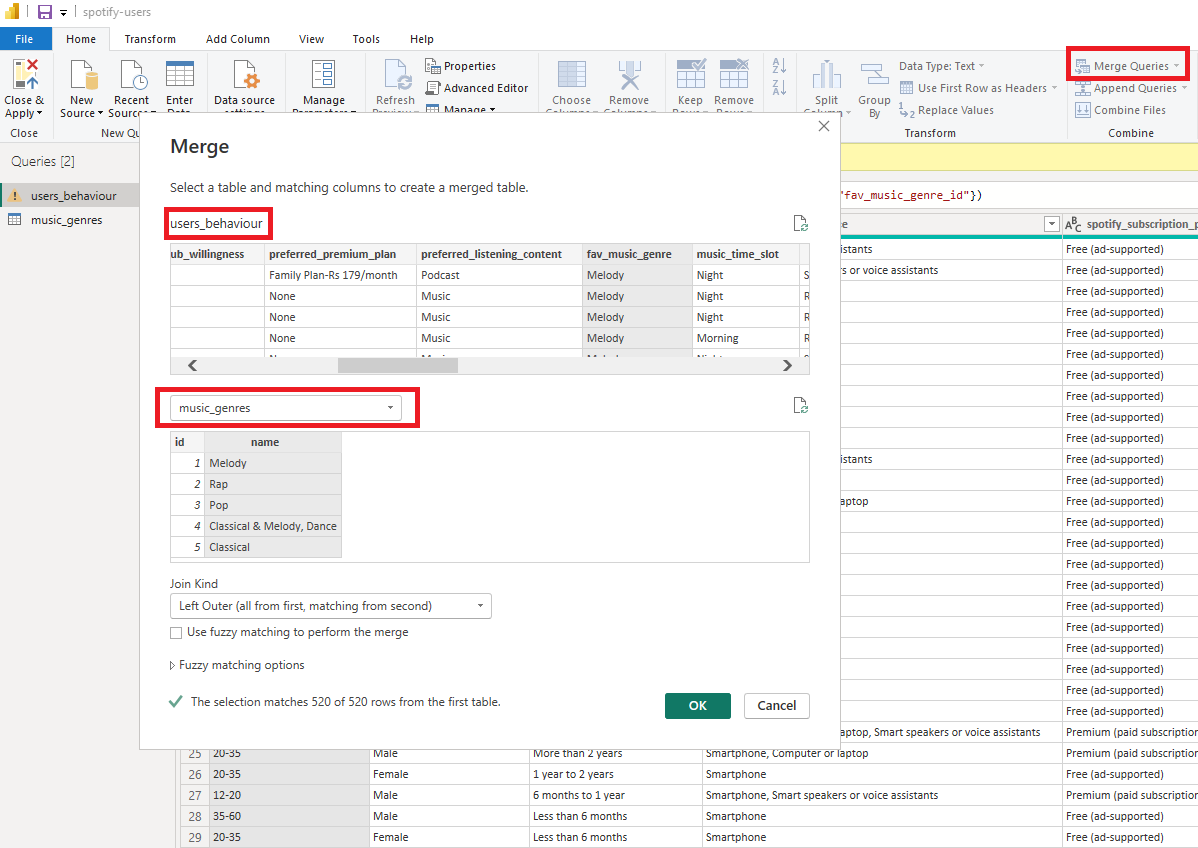
Or we can do it, using M-Language expression.
#"Join music genres" = Table.NestedJoin(#"Fix Trending genre", "fav_music_genre", music_genres, "name", "favorite_music_genre")Once you performed merging, you’ll see, that the new column was created, that represents the table we joined. For this expression we used NestedJoin function, that accepts such arguments:
- Name of the first table, to which you need to join another one
- Column, by which you want to perform join
- Name of the second table you would like to join
- Column in the second table, by which you want to perform join
- Result column name
To get corresponding ids from this column, we need to expand it.
#"ExpandTableColumn" = Table.ExpandTableColumn(#"Join music genres", "favorite_music_genre", {"id"}, {"fav_music_genre_id"})In this step, we expanded the column and extracted its id column as fav_music_genre_id.
By performing such transformations with other columns (moving them to the separate table) you can prepare data to be used in a Star Schema. After applying data source, you can start build relations between dimension and fact table to achieve the Star Schema.
Summary #
Data cleaning and transformation in Power Query is a crucial step in the data preparation process for Power BI and other data analysis tools. Power Query allows users to connect to various data sources, clean, reshape, and enrich the data before it enters the analysis phase. This involves tasks like removing duplicates, handling missing values, splitting columns, merging data from different sources, and applying custom transformations. By performing these operations in Power Query, users can ensure data consistency, data quality, and streamlined analyses, ultimately leading to more accurate and effective data visualizations and insights.
We are ready to provide expert's help with your product
or build a new one from scratch for you!