Embed Power BI report in Rails
Table of Contents
Why do you need Power BI? #
Power BI is a business analytics tool that allows users to create interactive visualizations and reports from a wide range of data sources for making data-driven decisions. Since the tool is developed by Microsoft it has wide integrations possibilities with Microsoft ecosystem components such as Azure, Office 365, etc. but it works well with other companies’ products as well.
Some reasons why Power BI may be beneficial for your business #
- Data Analysis: Power BI allows you to collect and analyze data from multiple sources, including Excel spreadsheets, cloud-based and on-premise databases, and more.
- Data Visualization: Power BI offers a wide range of visualizations and interactive dashboards to help you better understand your data and communicate your findings to others in your organization.
- Data Sharing: You can share your Power BI reports and dashboards with others in your organization or external stakeholders, such as clients or partners.
- Collaboration: Power BI allows for collaboration and teamwork, enabling you to work with others in your organization to analyze and understand data.
- Real-time Monitoring: With Power BI, you can monitor data in real-time, giving you a better understanding of what is happening in your business and allowing you to make informed decisions quickly.
- Power BI Embedded Analytics: This is a service offered by Microsoft that enables developers to embed Power BI reports and visualizations within custom applications or websites.
Real case example #
Imagine you run an e-commerce marketplace that sells a wide variety of products from multiple vendors. To keep track of all the data from your vendors, customers, and sales, you could use Power BI to connect to your database and create custom reports and dashboards. This can be used to identify trends and patterns in sales, and to make data-driven decisions to optimize the marketplace’s performance and increase revenue.
Power BI can also be used to track customer behavior and vendor performance. By analyzing data such as customer demographics, product preferences, and vendor ratings, the marketplace can identify opportunities to improve the customer experience and increase customer satisfaction. Additionally, tracking vendor performance can help the marketplace identify top-performing vendors and provide feedback and support to those who are struggling.
Power BI Embedded Analytics #
As we already found out with Power BI Embedded Analytics developers can embed Power BI reports and visualizations within a custom application or websites. It means that the users can be allowed to access Power BI functionality directly from within the application they are already using, without having to switch between applications!
Benefits of using Power BI Embedded Analytics #
- Customization: Developers can customize the look and feel of the embedded reports to match the branding of their application or website.
- Scalability: Power BI Embedded Analytics is designed to scale with your application or website, so you can handle large amounts of data and users.
- Real-time data: Embedded reports can be updated in real-time, allowing users to see the latest data as it becomes available.
- Security: Embedded reports inherit the security features of Power BI, ensuring that your data is protected.
- Cost-effectiveness: With Power BI Embedded Analytics, you only pay for what you use, making it a cost-effective solution for businesses of all sizes.
Real case example #
Let’s consider a financial services company that wants to provide its clients with real-time access to their investment portfolios and performance data. To achieve this, the company could use Power BI Embedded to embed interactive reports on its website. Clients could log in to their accounts on it and view their investment data in real-time without the need to download and manually update spreadsheets.
By embedding Power BI reports on its website, the financial services company could provide a more engaging and interactive experience for its clients, allowing them to drill down into specific data points and compare performance across different time periods. This could help clients make more informed decisions about their investments and ultimately lead to increased customer satisfaction and loyalty.
Embedding Power BI report in Rails #
Imagine you are a business owner. Your business has several successful products and you want to analyze some key metrics related to them (for instance popularity according to the area, user satisfaction, etc.). To do so you create a Power BI report or a dashboard with informative visualizations that can help to analyze your data and that’s it!
It works fine when you just want to analyze data by yourself but what if you want to share the data with company staff (with business analytics, data analytics, etc.) or even with your customers? Buying a Power BI PRO license and giving instructions on the Power BI service to each person who has to have access to the data doesn’t sound like an efficient idea, doesn’t it? In that case, you can simply embed Power BI content into the website that your business probably has. Let’s dive deeper into such approach.
Choosing Power BI embedded analytics solution #
Power BI embedded analytics offers two solutions:
- Embed for your customers Allows you to build an app that uses non-interactive authentication against Power BI. Your customers are likely to be external users, and they don’t need to sign in using Power BI credentials to view the embedded content.
- Embed for your organization Allows you to build an app that requires signing in using Power BI credentials. Once signed in users can only consume embedded content, they have access to on Power BI service.
Considering cases when we want to give our users the opportunity to analyze data directly on our site we should choose embed for your customers approach.
Official docs & default templates #
Of course, Microsoft has an official tutorial for embedding Power BI content using the embed for your customers solution. Furthermore, inside this tutorial, you’ll find default templates for embedding Power BI content. These templates are written using different technologies and programming languages, however unfortunately you won’t find Ruby On Rails in the list of technologies used for default templates.
But don’t be upset, after reading this article you will have your Rails app up and running with an embedded Power BI report inside of one of the views ;)
Authentication method #
To embed the Power BI report in a secure way we are going to implement an OAuth flow in our app. But to do it we have to choose the authentication method first.
Power BI embedded analytics offers two authentication methods:
- Service principal Your Azure AD app’s service principal object allows Azure AD to authenticate your embedded solution app against Power BI.
- Master user Your Azure AD app uses the credentials (username and password) of a Power BI user, to authenticate against Power BI.
Since service principal is recommended and a more secure way to embed Power BI content in this article we will consider exactly its usage.
Implementation #
Let’s finally write some code!
Step 1: Get and set necessary credentials #
To path OAuth flow through the service principal approach you have to get some credentials first.
Once you get your credentials - add them to the .env file.
SCOPE_BASE=https://analysis.windows.net/powerbi/api/.default
CLIENT_ID=
WORKSPACE_ID=
REPORT_ID=
CLIENT_SECRET=
TENANT_ID=Step 2: Create an action in the controller and the view #
I created an empty action in my controller and the view with some basic styles where the report will appear.
# app/controllers/application_controller.rb

class AnalyticsController < ApplicationController
  def index
  end
end
# app/views/analytics/index.html.erb
<header>
<h1 class="h1">Analytics</h1>
</header>
<main>
<div data-analytics-url-value="/load-report" >
<section class="powerbi-report-container">
</section>
</div>
</main>Step 3: Create a Stimulus contoller and connect it with view #
Generate a Stimulus controller.
rails g stimulus AnalyticsControllerIn this step, we will also add a “placeholder” for our report. To do it we need to install and use powerbi-client library in the Stimulus controller (we will need to use this library later for embedding as well).
Since I use Importmap for Rails to install the library I just need to add one line of code to my Importmap config.
# config/importmap.rb

# already pinned npm packages
pin "powerbi-client", to: "https://ga.jspm.io/npm:powerbi-client@2.18.5/dist/powerbi.js"
Once you pinned powerbi-client library let’s use it in the newly created Stimulus controller.
// app/javascript/controllers/analytics_controller.js

import { Controller } from "@hotwired/stimulus"
import * as pbi from "powerbi-client";

export default class extends Controller {
  static targets = ["container"]

  connect() {
  	const reportContainer = this.containerTarget;
    powerbi.bootstrap(reportContainer, { type: "report" });
  }
}
Once Stimulus controller is ready we have to connect it to the our view.
# app/views/analytics/index.html.erb
<header>
<h1 class="h1">Analytics</h1>
</header>
<main>
<div data-controller="analytics">
<section data-analytics-target="container" class="powerbi-report-container">
</section>
</div>
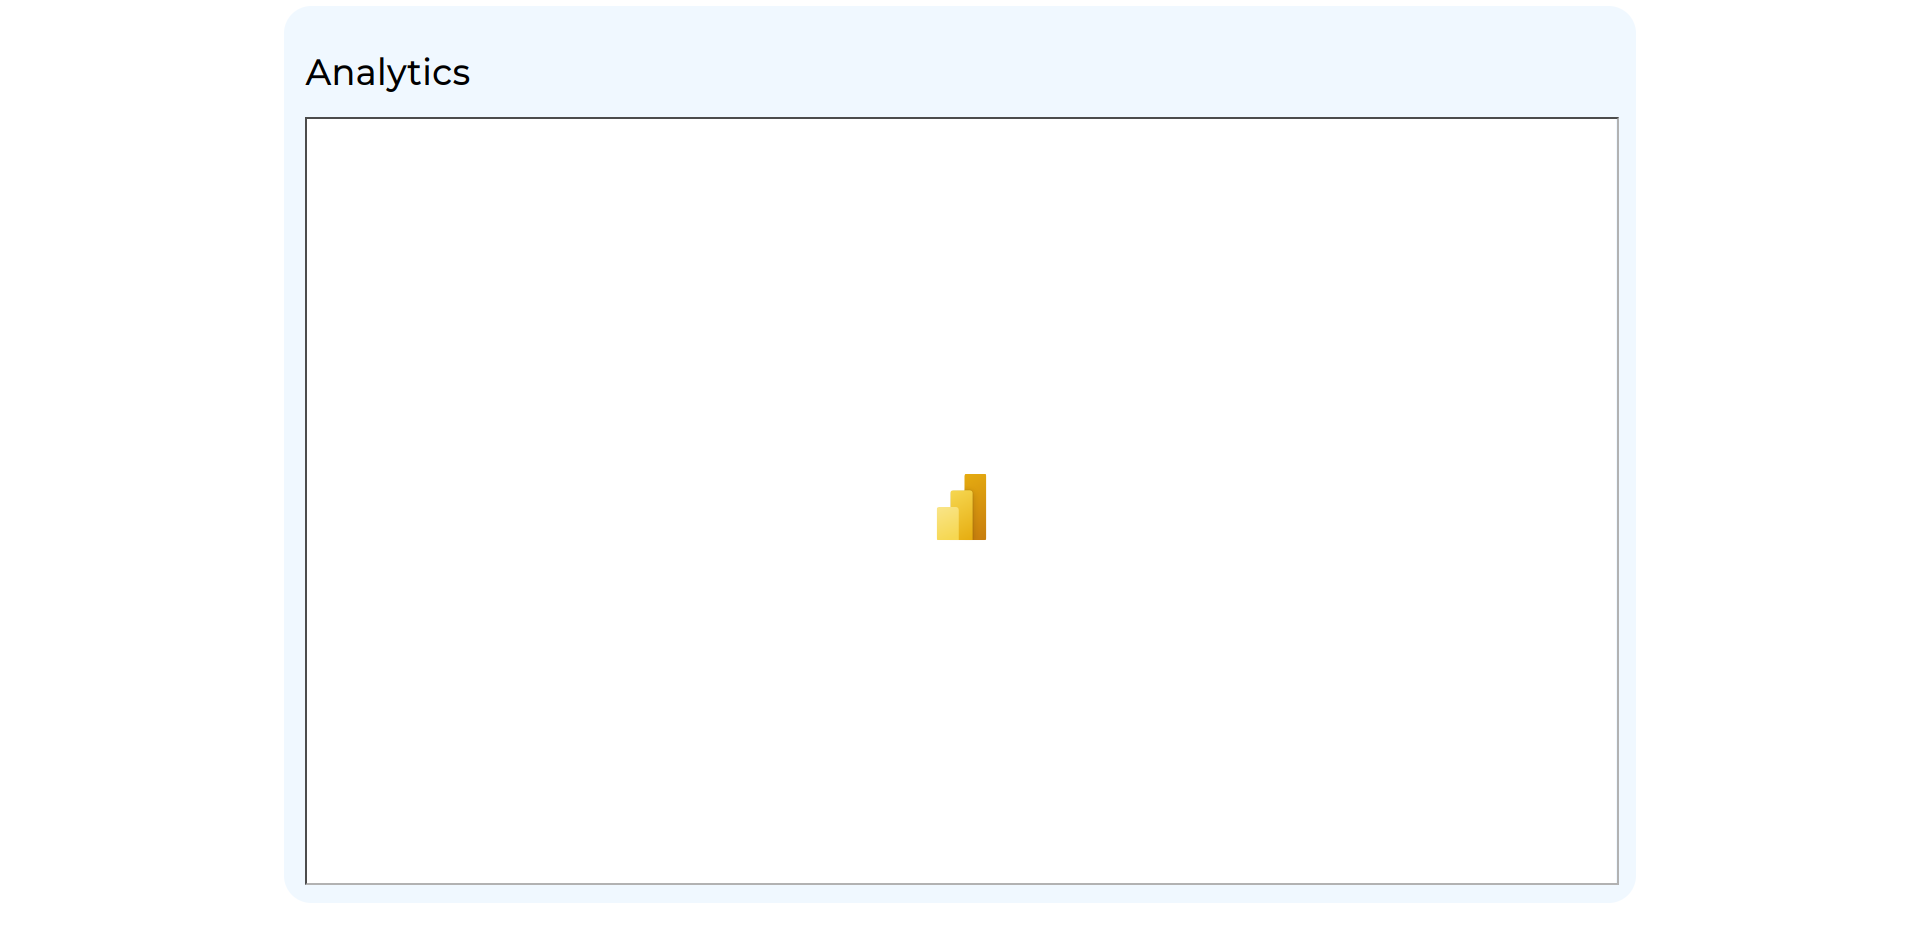
</main>After this, the Power BI-styled loader in the border has to appear on the page. Here is how my analytics page now looks like.
Step 4: Load embed config from the Stimulus controller #
To embed the Power BI report we have to use credentials that can be got during the OAuth flow. We will implement the OAuth flow on the BE side in the next step, it will be an action in the controller that returns some JSON with the necessary credentials.
Now let’s implement logic in the Stimulus controller that will load the necessary credentials by calling this action and parsing JSON data. Additionally, it will use parsed data and powerbi-client library to create configuration that we will use for embedding.
Here is how your Stimulus controller have to look like now.
// app/javascript/controllers/analytics_controller.js

import { Controller } from "@hotwired/stimulus"
import * as pbi from "powerbi-client";

export default class extends Controller {
  static targets = ["container"]

  connect() {
    const reportContainer = this.containerTarget;
    powerbi.bootstrap(reportContainer, { type: "report" });

    fetch("/load-embed-config").then(response => response.json()).then(embedConfig => {
      const reportLoadConfig = {
        type: "report",
        tokenType: pbi.models.TokenType.Embed,
        accessToken: embedConfig.token,
        embedUrl: embedConfig.report_details.embed_url,
      };
    });
  }
}
Step 5: OAuth flow implementation #
I created one more action in the Rails controller and call the service object where the OAuth flow is implemented. The service object will return the embed config that we will send back to the Stimulus controller as JSON where it will be used for embedding.
# app/controllers/application_controller.rb

class AnalyticsController < ApplicationController
  def index
  end

  def load_embed_config
    @report_embed_config = Analytics::OAuth::GetEmbedConfig.new.call

    respond_to do |format|
      format.json {
        render json: @report_embed_config
      }
      format.html { redirect_to index_path }
    end
  end
end
Before we consider the service object with OAuth flow let me briefly describe the logic that was used for the flow implementation.
Here is the service object implementation.
# app/services/analytics/o_auth/get_embed_config.rb

module Analytics
  module OAuth
    class GetEmbedConfig
      SCOPE_BASE = ENV['SCOPE_BASE']
      CLIENT_ID = ENV['CLIENT_ID']
      CLIENT_SECRET = ENV['CLIENT_SECRET']
      WORKSPACE_ID = ENV['WORKSPACE_ID']
      REPORT_ID = ENV['REPORT_ID']
      TENANT_ID = ENV['TENANT_ID']

      def call
        access_token = get_access_token
        api_request_headers = get_api_request_headers(access_token)
        report_details = get_report_details(api_request_headers)
        embed_token = get_embed_token(api_request_headers, report_details['datasetId'])
        report_embed_config(report_details, embed_token)
      end

      private

      def get_access_token
        HTTParty.post("https://login.microsoftonline.com/#{TENANT_ID}/oauth2/v2.0/token",
          headers: { 'Content-Type' => 'application/x-www-form-urlencoded' },
          body: {
            grant_type: 'client_credentials',
            client_id: CLIENT_ID,
            client_secret: CLIENT_SECRET,
            scope: SCOPE_BASE
          }
        )['access_token']
      end

      def get_api_request_headers(access_token)
        {
          'Content-Type' => 'application/json',
          'Authorization' => "Bearer #{access_token}"
        }
      end

      def get_report_details(headers)
        api_url = "https://api.powerbi.com/v1.0/myorg/groups/#{WORKSPACE_ID}/reports/#{REPORT_ID}"
        HTTParty.get(api_url, headers: headers)
      end

      def get_embed_token(headers, dataset_id)
        embed_token_api_url = 'https://api.powerbi.com/v1.0/myorg/GenerateToken'
        request_payload = {
          reports: [{ id: REPORT_ID }],
          datasets: [{ id: dataset_id }],
          targetWorkspaces: [{ id: WORKSPACE_ID }]
        }
        HTTParty.post(embed_token_api_url, headers: headers, body: request_payload.to_json)['token']
      end

      def report_embed_config(report_details, embed_token)
        {
          report_details: {
            report_id: report_details['id'],
            report_name: report_details['name'],
            embed_url: report_details['embedUrl']
          },
          token: embed_token,
        }
      end
    end
  end
end
If you have caught the authorization logic from the flowchart above you probably won’t be confused discovering the service object’s code.
Step 6: Embed Power BI report into view #
Once we implemented the authorization flow our Stimulus controller started to receive the necessary credentials and we are able to continue embedding the Power BI report.
To do so we just need to use the library one more time. It provides a method that accepts a container for the Power BI report and embed config as arguments and does all the necessary magic behind the scenes.
Here is the final state of the Stimulus controller.
// app/javascript/controllers/analytics_controller.js

import { Controller } from "@hotwired/stimulus"
import * as pbi from "powerbi-client";

export default class extends Controller {
  static targets = ["container"]

  connect() {
    const reportContainer = this.containerTarget;
    powerbi.bootstrap(reportContainer, { type: "report" });

    fetch("/load-embed-config").then(response => response.json()).then(embedConfig => {
      const reportLoadConfig = {
        type: "report",
        tokenType: pbi.models.TokenType.Embed,
        accessToken: embedConfig.token,
        embedUrl: embedConfig.report_details.embed_url,
      };
      powerbi.embed(reportContainer, reportLoadConfig);
    });
  }
}
Step 7: Enjoy the result #
Once all steps have been done you will have the interactive Power BI report embedded into your view.
You can find a source code in the GitHub repo.
Summary #
The Power BI Embedded Analytics is a great option for businesses that already have Power BI reports and a web app, as it allows them to easily embed interactive data visualizations and reports into their existing applications. This can help businesses to provide a more engaging and data-driven user experience for either their customers or admins, while also improving internal data analysis and decision-making processes.
We are ready to provide expert's help with your product
or build a new one from scratch for you!